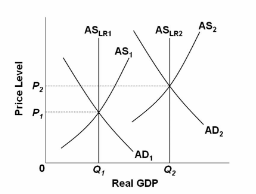
Refer to the graphs, where the subscripts on the labels denote years 1 and 2. From the graphs we can clearly conclude that the economy:
A. is not at full employment in either year.
B. is at full employment in year 1 but not in year 2.
C. is at full employment in year 2 but not in year 1.
D. is at full employment in both years.
D. is at full employment in both years.
You might also like to view...
When all other influences on firms' hiring plans remain the same, the
A) lower the real wage rate, the greater is the quantity of labor supplied B) higher the real wage rate, the greater is the quantity of labor demanded. C) lower the real wage rate, the smaller is the quantity of labor demanded. D) lower the real wage rate, the greater is the quantity of labor demanded. E) None of the above answers is correct because firms' hiring decisions depend on how profitable hiring a worker is, which depends on how much added profit the worker can create.
One of the tools of monetary policy is to change the discount rate. Since 2003
A) the Fed has not changed the discount rate. B) the Fed has pegged the discount rate to the reserve requirement. C) the Fed has kept the discount rate a fixed amount above the federal funds rate. D) the Fed has kept the federal funds rate one percentage point above the discount rate.
Consider a broom factory that permanently closes because of foreign competition. If the broom factory's workers cannot find new jobs because their skills are no longer marketable, they are classified as
When the firm is a price maker, at the quantity where profit is maximized,
A. MC>P>MR. B. MC=MR. C. MC=P=MR. D. MC.