Discuss at length the components of the sum-of-products algorithm.
What will be an ideal response?
Step 1: Truth Table Construction. First, determine how the circuit should behave under all possible circumstances. That is, determine the binary value that should appear on each output line of the circuit for every possible combination of inputs. This information can be organized as a truth table. If a circuit has N input lines, and if each input line can be either a 0 or a 1, then there are 2Ncombinations of input values, and the truth table has 2Nrows. For each output of the circuit, we must specify the desired output value for every row in the truth table. For example, if a circuit has three inputs and two outputs, then a truth table for that circuit has 23= 8 input combinations.
Step 2: Subexpression Construction Using AND and NOT Gates. Choose any one output column of the truth table built in Step 1 and scan down that column. Every place that you find a 1 in that output column, you build a Boolean subexpression that produces the value 1 (i.e., is true) for exactly that combination of input values and no other. To build this subexpression, you examine the value of each input for this specific case. If the input is a 1, use that input value directly in your subexpression. If the input is a 0, first take the NOT of that input, changing it from a 0 to a 1, and then use that complemented input value in your subexpression. You now have an input sequence of all 1s, and if all of these modified inputs are ANDed together (two at a time, of course), then the output value is a 1.
Step 3: Subexpression Combination Using OR Gates. Take each of the subexpressions produced in Step 2 and combine them, two at a time, using OR gates. Each of the individual subexpressions produces a 1 for exactly one particular case where the truth table output is a 1, so the OR of the output of all of them produces a 1 in each case where the truth table has a 1 and in no other case. Consequently, the Boolean expression produced in Step 3 implements exactly the function described in the output column of the truth table on which we are working.
Step 4: Circuit Diagram Production. Construct the final circuit diagram. To do this, convert the Boolean expression produced at the end of Step 3 into a circuit diagram, using AND, OR, and NOT gates to implement the AND, OR, and NOT operators appearing in the Boolean expression. This circuit diagram produces the output described in the corresponding column of the truth table created in Step 1.
You might also like to view...
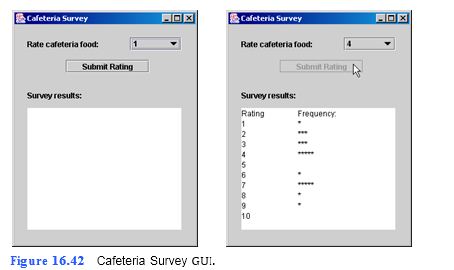
Twenty students were asked to rate, on the scale from 1 to 10, the quality of the food in the student cafeteria, with 1 being “awful” and 10 being “excellent.” Allow the user input to be entered using a JComboBox. Place the 20 responses in an int array and determine the frequency of each rating. Display the frequencies as a histogram in a multiline JTextField. A histogram (also known as a bar chart) is a chart where numeric values are displayed as bars. In such a chart, longer bars represent larger numeric values. One simple way to display numeric data graphically is with a histogram that shows each numeric value as a bar of asterisks (*). Figure 16.42 demonstrates the completed application.
a) Copying the template to your working directory. Copy the C:\Examples\ Tutorial16\Exercises\CafeteriaSurvey directory to your C:\SimplyJava directory.
b) Opening the template file. Open the CafeteriaSurvey.java file in your text editor.
c) Creating an array of the possible ratings. On lines 23–25, create String array choices consisting of 10 consecutive integers in String format (such as "1", "2", etc.) to contain the integers in the range 1–10, inclusive. Use line 23 for a comment and lines 24–25 to create and initialize the array.
d) Creating an array to store the responses. On lines 27–28, create an int array of length 11 named responses. This will be used to store the number of responses in each of the 10 categories (element 0 will not be used). Use line 27 for a comment and line 28 to create the array.
e) Customizing the ratingJComboBox. Customize the ratingJComboBox at line 54 so it will display the possible ratings.
f) Storing the responses. Let’s now look at method submitRatingJButtonActionPer- formed, which executes when the Submit Rating JButton is clicked. Line 101 (pro- vided in the template) increments variable responseCounter, which stores the number of responses entered. Line 102 then stores the rating entered by the user into variable input. We have added 1 to the result of ratingJComboBox.getSelected- Index because the indices of a JComboBox start at 0. The value in variable input now contains the index for that specific rating in array responses. On line 103, use input to increment the proper element of array responses.
g) Displaying the histogram. You will now display the results in the form of a histo- gram. Line 106 begins an if statement that executes when 20 responses have been entered. Within this if statement, a for statement is defined on lines 110–116. This statement loops once for each rating, displaying the rating on line 112 (followed by a tab character) and a newline character on line 114. You will add the number of stars that will be displayed to the right of each rating. On line 114, add the header of a for statement that loops from 1 until the number of votes for the current rating (stored in
responses). On line 115, add the left brace to begin the for statement’s body. On line 116, add an asterisk to the output. Because this for statement will loop the same number of times as there are votes for the current rating, the proper number of asterisks will be displayed. On line 118, add the right brace to end the for statement’s body. Follow the brace with a comment indicating the end of the for statement.
h) Saving the application. Save your modified source code file.
i) Opening the Command Prompt window and changing directories. Open the Command Prompt window by selecting Start > Programs > Accessories > Command Prompt. Change to your working directory by typing cd C:\SimplyJava\CafeteriaSurvey.
j) Compiling the application. Compile your application by typing javac Cafeteria- Survey.java.
k) Running the completed application. When your application compiles correctly, run it by typing java CafeteriaSurvey. Enter 20 different ratings by selecting values from ratingJComboBox then pressing the Submit Rating JButton. After 20 ratings have been entered, check that resultJTextArea contains the proper number of asterisks for each rating.
l) Closing the application. Close your running application by clicking its close button.
m) Closing the Command Prompt window. Close the Command Prompt window by clicking its close button.
The ________ is the area below the Ribbon that displays information such as security alerts
Fill in the blank(s) with correct word
What can data macros be used for?
What will be an ideal response?
Once the condition has been evaluated, either the if statement block or the else statement block will be executed, or both.
Answer the following statement true (T) or false (F)