What ways can an author display statistical results without redundant information using compressed displays?
What will be an ideal response?
Here, we want to focus on some additional methods of presenting statistical results that can improve research reports. Combined and compressed displays are used most often in applied research reports and government documents, but they can also help communicate findings more effectively in student papers and journal articles.
In a combined frequency display, the distributions for a set of conceptually similar variables with the same response categories are presented together, with common headings for the responses. For example, you could identify the variables in the leftmost column and the value labels along the top. Exhibit 12.2 is a combined display reporting the frequency distributions in percentage form for responses to the question, “How worried are you that you or someone in your family will become a victim of terrorism?” for the years 2002 through 2013. From this table, you can infer several pieces of information besides the basic distribution of attitudes. Except for the high blip in early October, when 24% of the population was very worried, for the most part, about 1 in 10 people have been very worried throughout the entire time period. However, there has been a noticeable increase in the percentage of the population who are not worried at all during this time.
Combined frequency display -- A table that presents together the distributions for a set of conceptually similar variables having the same response categories; common headings are used for the responses.
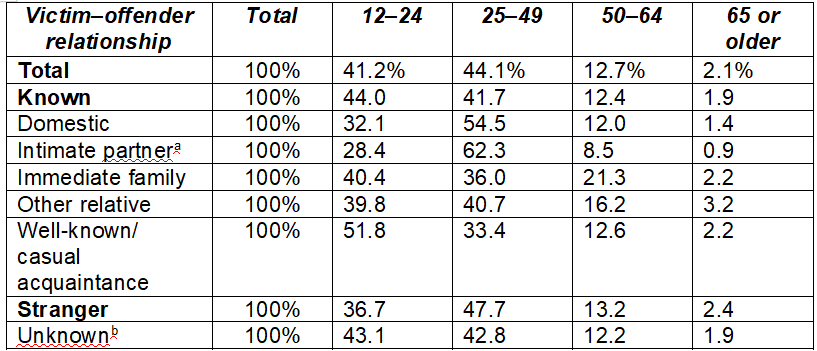
Compressed frequency displays can also be used to present cross-tabular data and summary statistics more efficiently by eliminating unnecessary percentages (such as those corresponding to the second value of a dichotomous variable) and by reducing the need for repetitive labels. Exhibit 12.3 presents a compressed display used to highlight the characteristics of violent victimization by victim and offender relationship across the life course. It took many cross-tabulations to create this display, but not all of the percentages are presented—only the percentages necessary to convey the bivariate distribution are presented. With this display, readers can easily compare the likelihood of different types of violence across age groups. For example, we can see that those age 65 or older are actually more likely to be victimized by strangers compared to all other age groups.
Compressed frequency display -- A table that presents cross-classification data efficiently by eliminating unnecessary percentages, such as the percentage corresponding to the second value of a dichotomous variable.
Combined and compressed statistical displays present a large amount of data in a relatively small space. To the experienced reader of statistical reports, such displays can convey much important information. They should be used with caution, however, because people who are not used to them may be baffled by the rows of numbers.
Graphs can also provide an efficient tool for summarizing relationships among variables. A good example of the use of graphs is the report Indicators of School Crime and Safety: 2013 (Robers, Kemp, Rathbun, Morgan, & Snyder, 2014). Exhibit 12.4 presents nonfatal serious violent victimization rates against students aged 12 to 18 that occurred both at and away from school for 1992 through 2012. These figures were obtained from the School Crime Supplement from the NCVS (Robers et al., 2014). Nonfatal serious violence includes rapes, robberies, and aggravated assaults. Interestingly, it appears that while serious violence against students away from school has been decreasing over this time period, victimization at school, except for the high point in the early 1990s, has remained relatively stable. As you can see, compressed displays in both table and graph form can be very illuminating!
Exhibit 12.2 Combined Frequency Distribution of Responses to Question About Fear of Terrorism, 2002–2013
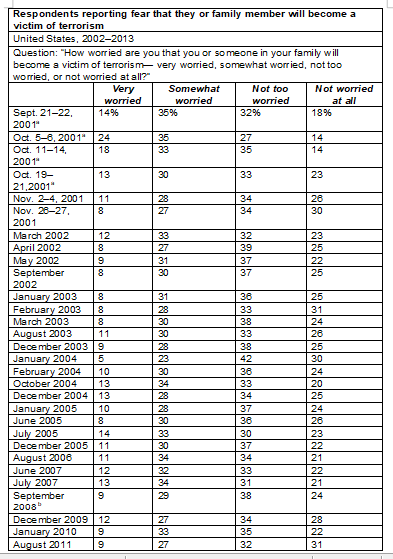
Exhibit 12.3 Compressed Display of the Distribution of Violent Victimization by Victim–Offender Relationship and Age Group, National Crime Victimization Survey, 2003–2013
You might also like to view...
Discuss the difference between imprints and impressions and the different types of fingerprints
What will be an ideal response?
There were originally three types of hiring grants under the COPS office. These were consolidated into the:
a. Universal Hiring Program b. World Wide Hiring Program c. Holistic Hiring Program d. Police Officer Grants Program
Which of the following is an example of the physical phenomena referred to as similarities?
A) an object that is louder and larger than other objects B) a person who appears under certain conditions more than one time C) a moving object that holds and attracts attention D) a man who resembles your best friend E) an odor that is distinct from any other
Restorative justice strategies attempt to repair the damage that a crime does to the victim, the victim's family, and society as a whole.
Answer the following statement true (T) or false (F)