Refer to the information provided in Figure 2.4 below to answer the question(s) that follow.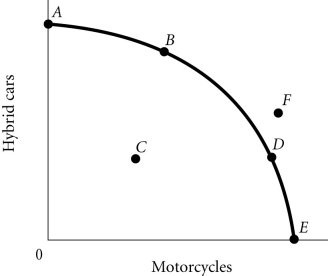 Figure 2.4According to Figure 2.4, an increase in unemployment may be represented by the movement from
A. B to A.
B. A to C.
C. C to D.
D. B to D.
Answer: B
You might also like to view...
The level of output (real GDP) that equals aggregate expenditure is called the ________ level of real GDP.
A. induced B. potential C. natural rate D. equilibrium
What is producer surplus? How is it measured?
What will be an ideal response?
Refer to Figure 3-8. The graph in this figure illustrates an initial competitive equilibrium in the market for apples at the intersection of D2 and S1 (point C). Which of the following changes would cause the equilibrium to change to point B?
A) a positive change in the technology used to produce apples and decrease in the price of oranges, a substitute for apples B) an increase in the wages of apple workers and an increase in the price of oranges, a substitute for apples C) an increase in the number of apple producers and a decrease in the number of apple trees as a result of disease D) a decrease in the wages of apple workers and an increase in the price of oranges, a substitute for apples
Concerns over unpleasant or unsafe standards of foreign labor do not affect most of U.S. trade because most U.S. trade is intra-industry and carried out with
a. high-income countries that have labor standards similar to the United States. b. low-income countries that have labor standards similar to the United States. c. high-income countries that have lower labor standards than the United States. d. low-income countries that have lower labor standards than the United States.