Solve the problem.The number of births in County A has been increasing in recent years. Use the information given in the bar graph for the years 1960 and 1990, letting x = 0 represent the year 1960 and letting y represent the number of births. Use the graph to estimate the number of births in 1980.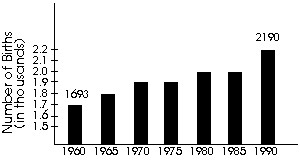
A. 1900
B. 1975
C. 1875
D. 2050
Answer: B
Mathematics
You might also like to view...
Multiply.(w - 12)2
A. w + 144 B. w2 - 24w + 144 C. 144w2 - 24w + 144 D. w2 + 144
Mathematics
Find the equation of the transverse axis of the hyperbola. -
-  = 1
= 1
A. y = 4 B. y = -4 C. x = -2 D. x = 2
Mathematics
Use transformations of the graph of y = x4 or y = x5 to graph the function.f(x) = -4x5 
A. 
B. 
C. 
D. 
Mathematics
Evaluate the function as indicated.Find f(-r) when f(x) = 6 - 8x.
A. r - 8x B. 6 + 8r C. 6 - 8r D. 6 + rx
Mathematics