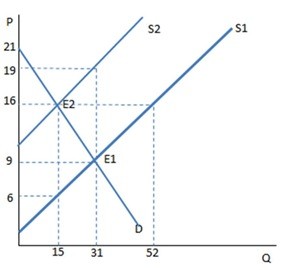
 The graph shown demonstrates a tax on sellers. Who bears the greater tax incidence?
A. The sellers
B. The buyers
C. The incidence is equally shared between buyer and seller.
D. The government
Answer: B
You might also like to view...
The aggregate production function for real business cycle models is shown as
a. yt = F(Kt, Nt). b. yt = ztF(Kt - Nt). c. yt = ztF(Kt, Nt). d. yt = zt/(Kt, Nt).
Assume Congress decides that oil companies are making too much profit and decides to tax oil companies for each gallon of gasoline produced. This would
A) shift the marginal cost curve up. B) shift the marginal cost curve down. C) shift the average fixed cost curve up. D) shift the average fixed cost curve down.
Samoa could produce either 3 coconuts or 12 pineapples per worker, while Guam could produce either 5 coconuts or 20 pineapples per worker. In this situation: a. if trade occurs, both countries will be able to consume beyond their original production possibilities frontiers. b. Guam will be better off if it exports coconuts and imports pineapples
c. both Samoa and Guam will be better off if Samoa produces both coconuts and pineapples. d. mutually beneficial trade cannot occur.
A utility possibilities frontier need not incorporate the utility of every individual.
A. True B. False C. Uncertain