Refer to the graph below for a pure monopoly. Which pricing model would the monopolist ______ to earn positive economic profits?
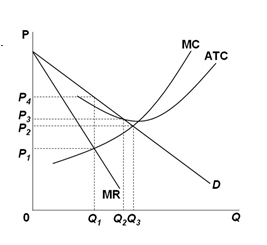
A. Profit-maximizing price only
B. Both profit-maximizing price and fair-return price
C. Both fair-return price and the socially optimal price
D. All three: profit-maximizing, fair return, and socially optimal prices
A. Profit-maximizing price only
You might also like to view...
Refer to the figure below.________ inflation will eventually move the economy pictured in the diagram from short-run equilibrium at point ________ to long-run equilibrium at point ________, 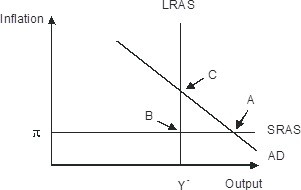
A. Rising; B; C B. Falling; A; C C. Falling; A; B D. Rising; A; C
In accordance with the law of supply, both individual and market supply curves are drawn:
a. horizontal. b. vertical. c. downward-sloping. d. upward-sloping.
Assume that the central bank purchases government securities in the open market. If the nation has highly mobile international capital markets and a flexible exchange rate system, what happens to the quantity of real loanable funds per time period and the nominal value of the domestic currency in the context of the Three-Sector-Model?
a. The quantity of real loanable funds per time period rises, and nominal value of the domestic currency remains the same. b. The quantity of real loanable funds per time period rises, and nominal value of the domestic currency rises. c. The quantity of real loanable funds per time period rises, and nominal value of the domestic currency falls. d. There is not enough information to determine what happens to these two macroeconomic variables. e. The quantity of real loanable funds per time period falls, and nominal value of the domestic currency rises.
Assuming that the SRAS curve is upward sloping, which of the following statements represents a correct and sequentially accurate economic explanation?
A) The demand for bonds falls, the price of bonds falls, the interest rate rises, investment spending declines, the AD curve shifts to the left, the price level declines and Real GDP decreases. B) The demand for bonds rises, the price of bonds rises, the interest rate rises, investment spending declines, the AD curve shifts to the left, the price level declines and Real GDP decreases. C) The supply of bonds rises, the price of bonds falls, the interest rate falls, investment spending rises, the AD curve shifts to the right, the price level declines and Real GDP decreases. D) The supply of bonds falls, the price of bonds rises, the interest rate falls, investment spending rises, the AD curve shifts to the right, the price level declines and Real GDP increases.