Graph the function.f(x) = 
A. 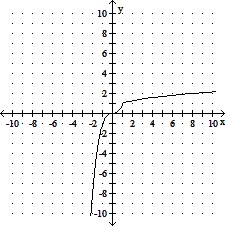
B. 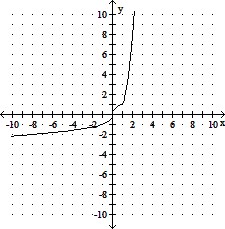
C. 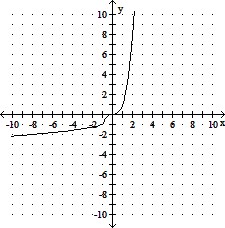
D. 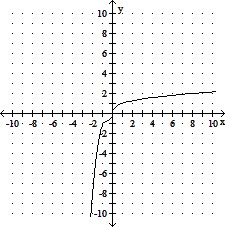
Answer: A
You might also like to view...
For the function f whose graph is given, determine the limit.Find  f(x) and
  f(x).
f(x).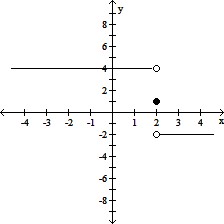
A. 4; -2 B. 1; 1 C. does not exist; does not exist D. -2; 4
Solve the problem.Ultraviolet radiation from the sun is thought to be one factor causing skin cancer. The amount of UV radiation a person receives is a function of the thickness of the earth's ozone layer which depends on the latitude of the area where the person lives. The following data represent the latitudes and melanoma rates for nine randomly selected areas in the United States. The melanoma rates refer to a three-year period. 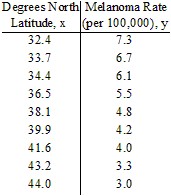 Graph the data on a scatter diagram treating latitude as the independent variable. Find an equation of the line containing the points
/> and  Express the relationship using function notation. Graph the line on the scatter diagram. Interpret the slope of the line. Use the line to predict the melanoma rate of an area with a latitude of 42.5 degrees north.
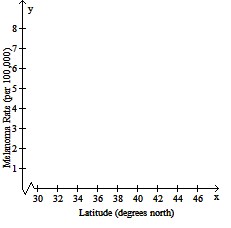
What will be an ideal response?
Provide an appropriate response.What are some word phrases that mean multiplication?
What will be an ideal response?
Solve. x + 2y + 2z = 10 3y + 3z = 21 z = 2
A. {(-4, 5, 2)} B. {(-4, 2, 5)} C. {(2, -4, 5)} D. {(2, 5, -4)}