Plot and interpret the appropriate scatter diagram.The table shows the study times and test scores for a number of students. Draw a scatter plot of score versus time treating time as the independent variable. 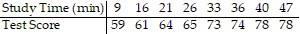 Effect of Study on Test Score
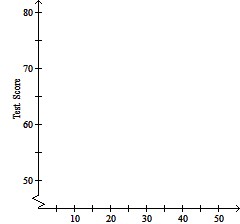 Time (min)
A. Effect of Study on Test Score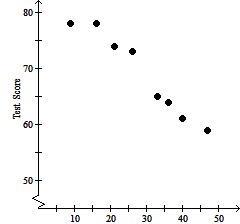
| Time (min) |
test scores.
B. Effect of Study on Test Score
| Time (min) |
test scores.
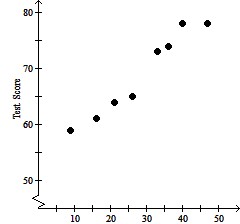
C. Effect of Study on Test Score

| Time (min) |
test scores.
D. Effect of Study on Test Score

| Time (min) |
test scores.
Answer: B
You might also like to view...
Find the values of x for which given series converges.
A. 0 < x < 14 B. -1 ? x ? 1 C. -14 ? x ? 14 D. -14 < x < 14
Suppose you have the following project digraph. (The numbers in parentheses represent hours.)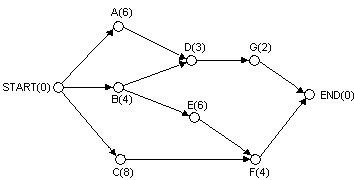 Using the decreasing-time algorithm to schedule this project with two processors, the project finishing time is
A. 18 hours. B. 17 hours. C. 20 hours. D. 19 hours. E. none of these
Provide an appropriate response.Points represent:
A. an additional cost of financing B. monthly payments C. 2 percent of the amount borrowed D. a 3 percent up front payment
Solve the system using the inverse of the coefficient matrix of the equivalent matrix equation.3x + y + 3z - w = -6 -x - 2y + z - 4w = 5 -2x + 3y + 3z + w = 7 3x - y - z - 4w = -13
A. (-1, 0, 4, 3) B. (-3, -2, 2, 1) C. (-3, 2, -2, -1) D. No solution