Graph the set of real numbers on a number line.{x|0 < x < 4}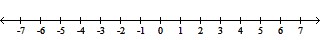
A. ![]()
B. ![]()
C. ![]()
D. ![]()
Answer: C
You might also like to view...
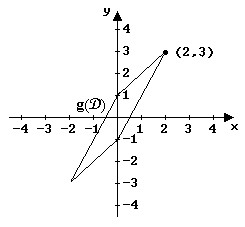
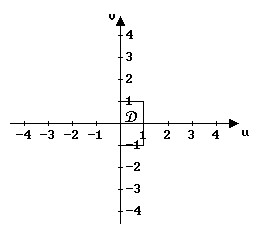
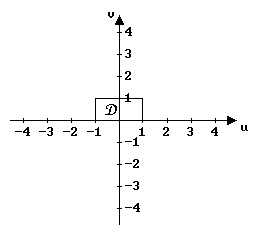
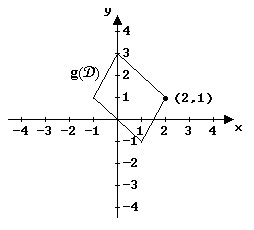
Sketch D and g(D) from the description of D and change of variables  x = u + v, y = 2u - v where D is the rectangle 0 ? u ? 1, -1 ? v ? 1
 ?
?
A.
 ? ? |  |
B.
 ? ? |  |
C.
 ? ? |  |
D.
 ? ? |  |
Provide an appropriate response.Let A =  and B =
  .Does the matrix A - B have an inverse?
A. Yes B. No
Determine if the function is one-to-one.
A. Yes B. No
Solve the problem.The populations and land areas are shown in the table for various regions: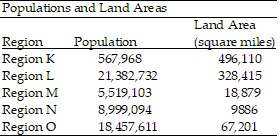 (i) The unit ratio of population to land area is called the population density. Find the population density of each region listed in the table.(ii) Which region listed in the table has the greatest population density? (iii) Which region listed in the table has the least population density?
A. (i) Region K:  ; Region L:
  ; Region M:
  ;
;
Region N:  ; Region O:
(ii) Region L has the greatest population density.
(iii) Region K has the least population density.
B. (i) Region K:  ; Region L:
  ; Region M:
  ;
;
Region N:  ; Region O:
(ii) Region K has the greatest population density.
(iii) Region L has the least population density.
C. (i) Region K:  ; Region L:
  ; Region M:
  ;
;
Region N:  ; Region O:
(ii) Region O has the greatest population density.
(iii) Region K has the least population density.
D. (i) Region K:  ; Region L:
  ; Region M:
  ;
;
Region N:  ; Region O:
(ii) Region N has the greatest population density.
(iii) Region K has the least population density.