Construct a histogram of the given frequency distribution.The frequency distribution indicates the number of fish caught by each fisherman in a group of 250 fishermen.

A. 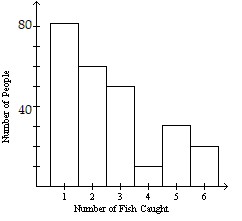
B. 
C. 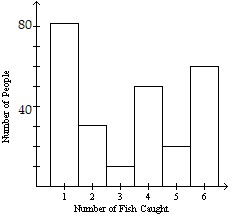
D. 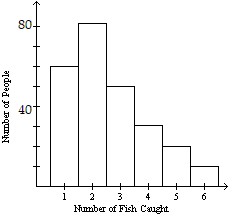
Answer: A
Mathematics
You might also like to view...
Suppose u and v are differentiable functions of x. Use the given values of the functions and their derivatives to find the value of the indicated derivative.u(1) = 3, u '(1) = -5, v(1) = 7, v '(1) = -3.
 at x = 1
A. - 
B. - 
C. - 
D. - 
Mathematics
Round each number to its largest place value to estimate the quotient.898,539 ÷ 35
A. 225 B. 22,500 C. 2000 D. 20,000
Mathematics
Perform the indicated operation. Simplify, if possible. +
+ 
A. 
B. 
C. 
D. 
Mathematics
Combine like terms.6x + 3y + 4x + 5y
A. 10x + 8y B. 10x + 3y + 5y C. 8x + 10y D. 18xy
Mathematics