Refer to the diagram. A decrease in supply is depicted by a:
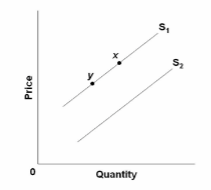
A. move from point x to point y.
B. shift from S 1 to S 2 .
C. shift from S 2 to S 1 .
D. move from point y to point x.
C. shift from S 2 to S 1 .
You might also like to view...
A country produces only apples and bananas. Moving from point A to point B along its production possibilities frontier, 5 apples are forgone and 4 bananas are gained. What is the opportunity cost of a banana?
A) 1 banana B) 5/4 of an apple C) 4 apples D) 4/5 of an apple E) None of the above answers is correct.
Which of the following lags reduces the effectiveness of active policy?
a. Preliminary lag b. Accounting lag c. Self-correction lag d. Recognition lag e. Execution lag
Suppose a bank has demand deposits of $100,000 and the legal reserve requirement is 20 percent. If the bank currently has $100,000 in reserves, it could expand the money supply by as much as
a. $100,000 b. $400,000 c. $0 d. $20,000 e. $80,000
To compensate for the possibility of indirect crowding? out, a government engaging in expansionary policy aimed at eliminating a recessionary gap could
A) reduce taxes rather than increase government spending.
B) increase spending less than the simplest Keynesian model would predict.
C) both reduce taxes and reduce spending to be able to achieve full employment.
D) increase spending more than the simplest Keynesian model would predict.