The figure below illustrates a tariff. On the graph, Q represents quantity and P represents price.
Figure 17-11
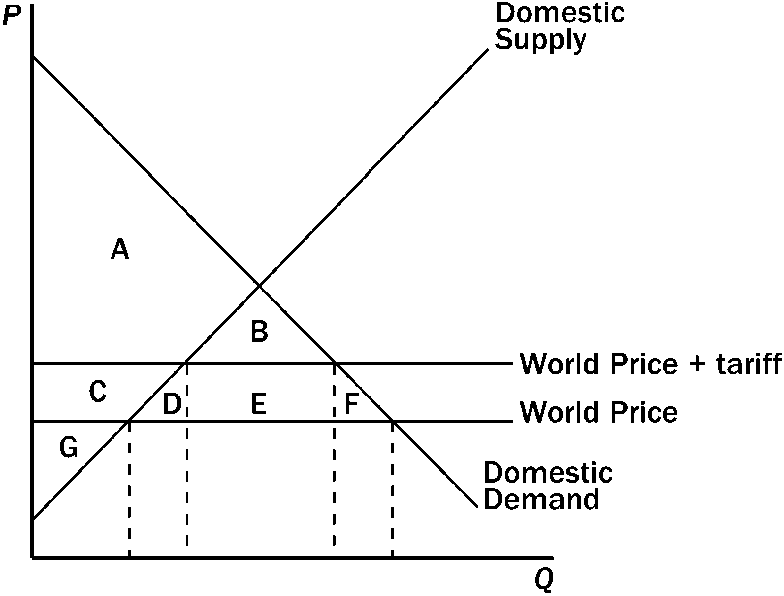
Refer to Figure 17-11. The deadweight loss created by the tariff is represented by the area
a.
B.
b.
D + F.
c.
D + E + F.
d.
B + D + E + F.
b
You might also like to view...
If the world terms of trade equal those of country H, then
A) country H but not country F will gain from trade. B) country H and country F will both gain from trade. C) neither country H nor F will gain from trade. D) only the country whose government subsidizes its exports will gain. E) country F but not country H will gain from trade.
If retailers have a resale price maintenance agreement with a manufacturer to sell the product at a minimum price of $100, this means that brick and mortar stores ________ charge a price below $100 and online retailers ________ charge a price below $100.
A) can; can B) cannot; can C) cannot; cannot D) can; cannot
Assets that the IMF created to be used by countries to settle international payment obligations are called
A) capital intervention accounts. B) foreign currency reserves. C) gold reserves. D) special drawing rights.
Investment spending is a leakage from the circular flow model
a. True b. False Indicate whether the statement is true or false