Solve the problem.The graphs below represent the supply and demand for a product at various prices per unit. Approximately how many units should be produced so that supply equals demand?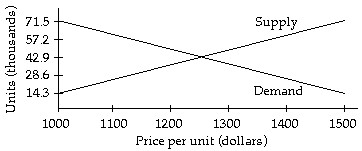
A. 2250 units
B. 42,900 units
C. 42.9 units
D. 2255 units
Answer: B
You might also like to view...
Convert the units.49.7 g =  kg
kg
A. 49,700 kg B. 4970 kg C. 0.00497 kg D. 0.0497 kg
At what points is the given function continuous?f(x, y) = 
A. All (x, y) such that x ? y B. All (x, y) such that x ? - y C. All (x, y) ? (0, 0) D. All (x, y)
Suppose that the average adult in the United States will work x number of days (rounded to the nearest day) to earn enough to pay for all of the household's leisure activities in that year. This number can be calculated by multiplying the average percent of household income spent on leisure activities by 365 (the number of days in a year). The bar graph shows the percent of income spent in various countries of the world. Use the graph to answer the question.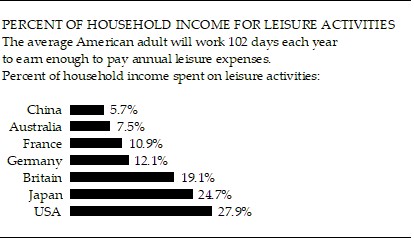 In which country is the highest percent of income spent on leisure activities? What percent is this?
A. USA; 72.1% B. Japan; 24.7% C. China; 94.3% D. USA; 27.9%
Multiply.(x + 1)(x - 1)(5x - 5)
A. 5x3 - 5x2 - 5x + 5 B. 5x3 + 5x2 - 5x - 5 C. 5x3 - 15x2 + 15x - 5 D. 5x3 - 5x2 + 5x - 5