According to the graph shown, what is the market price?
This graph represents the cost and revenue curves of a firm in a perfectly competitive market.
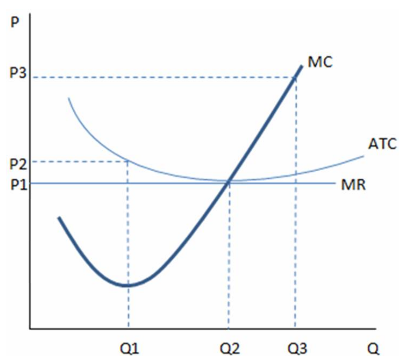
A. P1
B. P2
C. P3
D. Cannot tell from the graph.
A. P1
You might also like to view...
There were large decreases in productivity during
A. the 1990s and early 2000s. B. the late 1980s. C. the late 1970s and the 2010s. D. the 1950s and 1960s.
The earnings of all employees in a competitive economy would be equal if
a. workers were perfectly mobile among jobs. b. all jobs were equally attractive. c. all of the above are true. d. all individuals were homogeneous.
______________: Using right methods of production
Fill in the blank(s) with the appropriate word(s).
Which of the following is a characteristic of a monopolistically competitive market?I.Firms sell differentiated products.II.Each firm's product is a close substitute for other firms' products.III.Firms freely enter and exit the market.
A. I only B. I and III only C. II and III only D. I, II, and III