Refer to the information provided in Figure 8.8 below to answer the question(s) that follow. 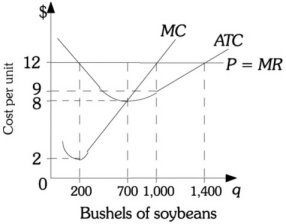 Figure 8.8 Refer to Figure 8.8. At the market price of $8 per bushel, if this farmer produces the profit-maximizing level of soybeans, the total revenue would be
A. $1,200.
B. $2,800.
C. $5,600.
D. $8,400.
Answer: C
You might also like to view...
The curve labeled A in the above figure is
A) a short-run aggregate supply curve. B) an aggregate demand curve. C) a long-run aggregate supply curve. D) a production possibilities curve.
Explain why the shape of the demand curve will determine the how a shock to the market equilibrium affect price and quantity
What will be an ideal response?
A firm is producing a joint product, Product A and Product B, with variable proportions. At its current production levels, the marginal benefit of producing Product A is $8 and the marginal cost is $12 and the marginal benefit of producing Product B is $8 and the marginal cost is $2. To maximize profits, the managers of the firm should produce ________ of Product A and ________ of Product B.
A) more; less B) more; more C) less; less D) less; more
Which of the following is a characteristic of the monopolistic competition market structure?
a. Many firms and a homogeneous product. b. Few firms and differentiated products. c. Few firms and similar products. d. Few firms and a homogeneous product. e. Many firms and differentiated products.