Figure 11-2
?
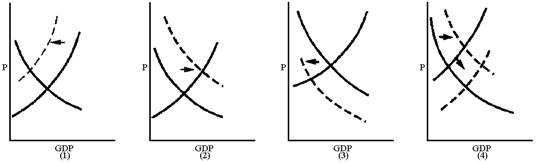
Which graph in Figure 11-2 best reflects a Keynesian’s view of the short-run impact of an increase in the personal income tax rate?
A. 1
B. 2
C. 3
D. 4
Answer: C
You might also like to view...
If the supply of iPods increases, then
i. the supply curve for iPods has shifted rightward. ii. the price of iPods has decreased. iii. there will be a movement upward along the iPod supply curve. A) i only B) i, ii and iii C) i and ii D) ii and iii E) i and iii
A rise in the minimum wage increases the demand for union labor because this policy change
A) lowers the wage rate paid to union labor. B) raises the productivity of union labor. C) lowers the cost of a substitute for union labor. D) raises the cost of a substitute for union labor.
At a given price level, a decrease in consumer credit will shift the aggregate demand curve:
A) rightward. B) leftward. C) both. D) none of the above.
Why do firms collude to become a cartel? Because it allows them to
a. develop innovations without the threat of competition within the industry b. compete in order to increase market share c. act like a monopoly d. diversify their markets without fear of losing market share e. increase their own individual concentration ratio