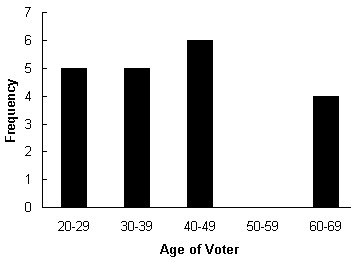
Solve the problem.In a survey, 20 voters were asked their age. The results are summarized in the frequency table below. Make a histogram corresponding to the frequency table. 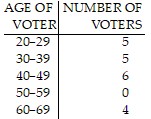
What will be an ideal response?
Mathematics
You might also like to view...
Find the length and direction (when defined) of u × v.u = 4i + 2j + 8k, v = -i - 2j - 2k
A. 180;  i +
i +  j +
j +  k
k
B. 180;  i +
i +  k
k
C. 6 ;
;  i +
i +  k
k
D. 6 ;
;  i -
i -  k
k
Mathematics
Find the directrices of the hyperbola.49x2 - 576y2 = 28,224
A. y = ± 
B. x = ± 
C. x = ± 
D. y = ± 
Mathematics
Multiply.(x - 9y)(x + 5y)
A. x - 4xy - 45y B. x2 - 4xy - 4y2 C. x2 - 7xy - 45y2 D. x2 - 4xy - 45y2
Mathematics
The graph of a function f is given. Use the graph to answer the question.Find the numbers, if any, at which f has a local minimum. What are the local minima?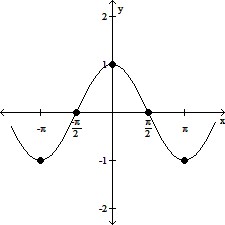
A. f has a local minimum at x = 0; the local minimum is 1 B. f has a local minimum at x = -? and ?; the local minimum is -1 C. f has a local minimum at x = -?; the local minimum is -1 D. f has no local minimum
Mathematics