Figure (a) represents the domestic demand and supply of televisions. However, if free trade is allowed and the current world price of televisions is P1 as shown in Figure (b) then the domestically produced quantity would be
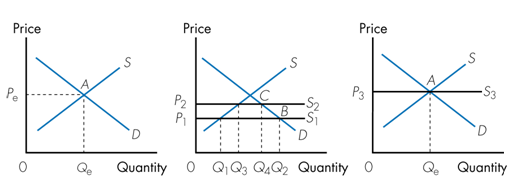
a. Q1 and the domestically consumed quantity of televisions would be Q2.
b. Q2 and the domestically consumed quantity of televisions would be Q1.
c. Q3 and the domestically consumed quantity of televisions would be Q4.
d. Q4 and the domestically consumed quantity of televisions would be Q3.
a. Q1 and the domestically consumed quantity of televisions would be Q2.
You might also like to view...
Different banks:
A. may offer loans at different rates. B. all offer loans at the same interest rate. C. are mandated to follow the Fed's set interest rate. D. never offer loans at exactly the same rates.
Specialization according to comparative advantage, followed by trade, allows everyone to acquire more of the goods they want
a. True b. False Indicate whether the statement is true or false
Federal revenue as a percentage of GDP dropped significantly in the early 2000 . because
a. of increased transfer payments due to the recession. b. of decreased transfer payments due to the recession. c. of tax-rate decreases passed by the Bush administration and Congress as well as recessionary impacts. d. of tax-rate increases passed by the Bush administration and Congress as well a recessionary effects. e. of tax-rate increases passed by the Bush administration .
Which of the following is not a lagging indicator?
a. Duration of unemployment b. Commercial and industrial loans c. Stock prices d. Prime rate