Using Figure 1 above, if the aggregate demand curve shifts from AD3 to AD2 the result in the long run would be: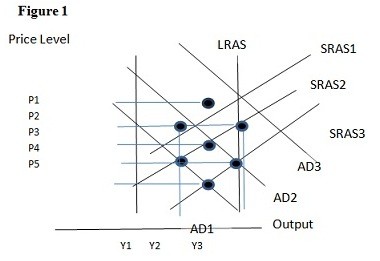
A. P1 and Y2.
B. P2 and Y1.
C. P3 and Y1.
D. P3 and Y2.
Answer: D
You might also like to view...
The accompany diagram shows the market for gasoline, in which there are 1,000 consumers. Gasoline can be produced at a constant marginal cost of $2 per gallon. When the market is in equilibrium, the average consumer uses 15 gallons of gasoline per week.
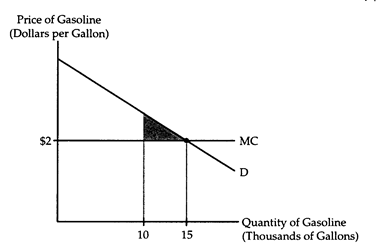
Suppose a war breaks out, temporarily limiting the amount of gasoline available for civilian use to 10,000 gallons per week. In the interest of fairness, the government allocates 10 gallons per week to each consumer, taxes each consumer $20 per week, and forbids barter in gasoline. Will the shaded area in the diagram accurately measure the loss in consumers' surplus? Why or why not?
The new Keynesian model has ________ in common with the real business cycle model
A) wage and price stickiness B) a theory of aggregate demand C) procyclical inflation D) a microeconomic foundation
In 2006, before the Great Recession, the economy was booming and consumer demand was high, making the:
A. demand for loanable funds increase and shift to the right. B. demand for loanable funds decrease and shift to the left. C. supply of loanable funds increase and shift to the right. D. supply of loanable funds decrease and shift to the left.
According to public choice theorists, the primary concern of policy makers is
a. the public interest b. achieving a social optimum for the economy as a whole c. to protect their jobs d. the provision of public goods e. market failure