Solve the problem.This chart shows the number of meals served in a restaurant during each of the past 4 months. Assume that the information in the chart defines a function with the name g. Find g(March).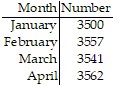
A. 3500
B. 3557
C. 3541
D. 3562
Answer: C
Mathematics
You might also like to view...
State whether you think the difference between what occurred and what you would expect by chance is statistically significant.You draw a card at random from a deck of cards and replace it. You repeat this 100 times and get an ace 40 times.
A. Statistically significant B. Not statistically significant
Mathematics
Factor the expression completely, if possible.49x2 + 42x + 9
A. (7x + 3)2 B. (7x - 3)2 C. (7x + 3)(7x - 3) D. (49x + 9)(x + 1)
Mathematics
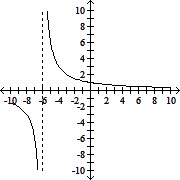
List the x- and y-intercepts, and graph the function.f(x) = 
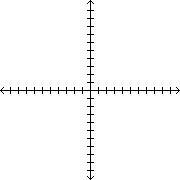
A. No x-intercepts, y-intercept:  ;
;
B. No x-intercepts, y-intercept:  ;
;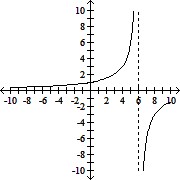
C. No x-intercepts, y-intercept:  ;
;
D. No x-intercepts, y-intercept:  ;
;
Mathematics
Evaluate the integral. Select the correct answer.
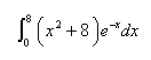

Mathematics