What do the Lorenz curves for wealth and income in the United States look like? Which is closer to the line of equality?
What will be an ideal response?
Both the Lorenz curve for wealth and the Lorenz curve for income are bowed outward from the line of equality because neither wealth nor income is equally distributed. The Lorenz curve for income is closer to line of equality than the Lorenz curve for wealth because income, while unequally distributed, is more equally distributed than is wealth.
You might also like to view...
Refer to Figure 15-7. Suppose the Fed lowers its target for the federal funds rate. Using the static AD-AS model in the figure above, this situation would be depicted as a movement from
A) B to A. B) A to B. C) C to D. D) E to A. E) C to B.
Pollution is caused by a market failure, in an industry in which there is
A) unemployment. B) an over-allocation of resources in production. C) excess demand. D) excessive cost borne by the firm.
Using Figure 1 above, if the aggregate demand curve shifts from AD2 to AD1 the result in the long run would be: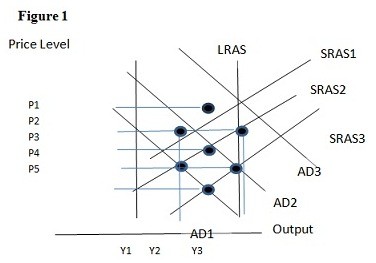
A. P4 and Y1. B. P4 and Y2. C. P5 and Y1. D. P5 and Y2.
If a nation protects an industry because it believes that there are positive externalities in the production process, it is asserting that the free market will
A) produce less than is optimal from society's point of view. B) produce more than is optimal from society's point of view. C) produce the correct amount but charge too high a price. D) produce the correct amount but charge too low a price.