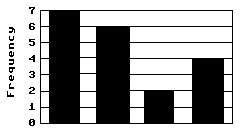
Construct a histogram for the given data. The following data are the number of sweatshirts sold each day for 19 days. 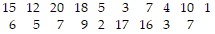 Construct a frequency histogram for the data using the given class intervals in the frequency table below.
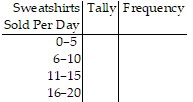
What will be an ideal response?
| 0-5 | 6-10 | 11-15 | 16-20 |
Mathematics
You might also like to view...
Simplify the expression.5 - 5(4w - 2) + w
A.  w - 15
B. 19w - 15
C. 19w + 15
D.  w + 15
Mathematics
Determine whether the following is a probability model.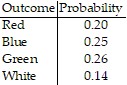
A. Yes B. No
Mathematics
Evaluate the root, if possible.- 
A. -6 B. -36 C. Not real D. -5
Mathematics
Use the quotient rule to simplify.
A. 5
B. 
C. 
D. 5
Mathematics