The graph below shows the approximate annual percentage growth rate in world population for the years 1960 through 2010. Data is estimated by the UN Census Bureau.Annual Growth Rate (Percentage) 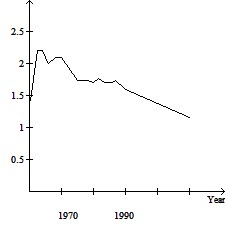 Use the graph to answer the question.In which year(s), if any, during the period 1960-2010 is world population constant?
A. 1969-1971
B. 1962-1964, 1969-1971, 1975-1980
C. 1962-1964
D. None
Answer: D
Mathematics
You might also like to view...
Draw a sketch to represent the vector. Refer to the vectors pictured here. ![]() b - c
b - c
A. ![]()
B. ![]()
Mathematics
Simplify. ÷
÷  -
-  ?
? 
A. 25
B. 1
C. 
D. 2
Mathematics
Use a graphing calculator to solve the equation. Round to two decimal places.11x - 3 = 4
A. 0.09 B. 1.04 C. 0.81 D. 0
Mathematics
List the intercepts of the graph. 
A. (-5, 0) B. (0, 5) C. (0, -5) D. (5, 0)
Mathematics