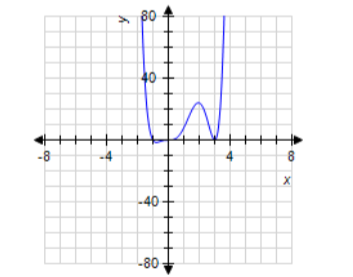
Solve the problem.The graph shows the total sales in thousands of dollars from the distribution of x thousand catalogs. Find the average rate of change of sales with respect to the number of catalogs distributed for the change in x.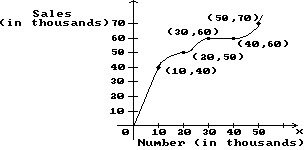 10 to 30
A. 3
B. 
C. 
D. 1
Answer: D
Mathematics
You might also like to view...
Solve. +
+  =
= 
A. 
B. 
C. 
D. 
Mathematics
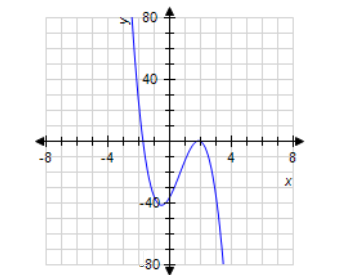
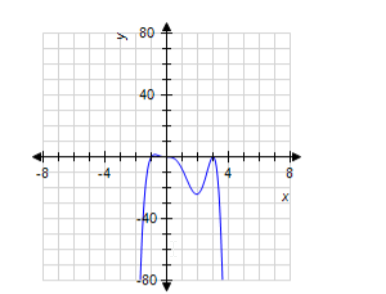
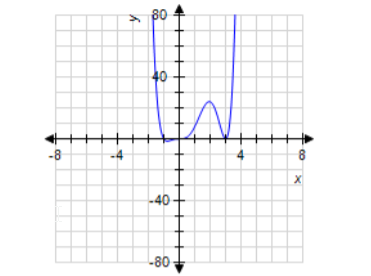
sketch the graph of the function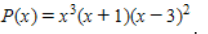
a.
b.

c.
d.
Mathematics
Solve the problem. Express your answer as an integer or simplified fraction.7x - (5x - 1) = 2
A. 
B. 
C. - 
D. - 
Mathematics
Use Bayes' rule to find the indicated probability.Two shipments of components were received by a factory and stored in two separate bins. Shipment I has 2% of its contents defective, while shipment II has 5% of its contents defective. If it is equally likely an employee will go to either bin and select a component randomly, what is the probability that a defective component came from shipment II?
A. 0.714 B. 0.222 C. 0.5 D. 0.2
Mathematics