Refer to the diagram. The initial aggregate demand curve is AD 1 and the initial aggregate supply curve is AS 1 . In the long run, the aggregate supply curve is vertical in the diagram because:
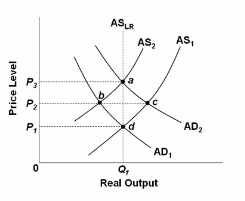
A. nominal wages and other input prices are assumed to be fixed.
B. real output level Q f is the potential level of output.
C. price level increases produce perfectly offsetting changes in nominal wages and other input prices.
D. higher-than-expected rates of actual inflation reduce real output only temporarily.
C. price level increases produce perfectly offsetting changes in nominal wages and other input prices.
You might also like to view...
Suppose the demand curve for bus travel is downward sloping, and the income elasticity of demand for bus travel is negative.
(i) Design an indifference curve-budget line diagram showing the substitution and income effects created when the price of bus travel falls. In your diagram, place bus travel on the horizontal axis and all other goods on the vertical axis. (ii) How you can tell from your diagram that the income elasticity of demand for bus travel is negative? Explain.
The above figure shows the marginal social benefit, marginal private cost and marginal social cost of producing steel. There is a marginal external ________ of ________ per ton
A) benefit; $200 B) benefit; $100 C) cost; $200 D) cost; $100
Potential GDP is estimated to grow at a rate of 3.2% in the United States. Actual GDP in the U.S
A) always grows at a slower rate than potential GDP. B) is the same as potential GDP if all firms in the economy were working at capacity. C) always grows at the same rate as potential GDP. D) always grows at a faster rate than potential GDP.
A sole proprietor has limited liability and cannot be forced to pay its creditors from his/her personal resources
Indicate whether the statement is true or false