Solve the problem.Data regarding the amount spent by a government department is represented in the following graph. Find the change in amount spent for the years shown in the graph. Is the graph a straight line?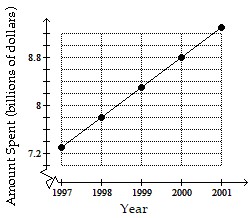
A. Change for each year: $0.52 billion; yes
B. Change from 1998 to 1999: $0.52 billion, change from 1999 to 2000: $0.13 billion; no
C. Change for each year: $0.33 billion; yes
D. Change for each year: $0.13 billion; yes
Answer: A
You might also like to view...
Write as an improper fraction.6
A. 
B. 
C. 
D. 
Provide an appropriate response.Convert the following to ordinary notation: 6.35 ? 10-4
Fill in the blank(s) with the appropriate word(s).
Provide an appropriate response.Solve for x:  +
+  = 1
= 1
A. 0 B. 2 C. -2 D. 8 E. -8
Solve the problem.A store takes inventory of a popular clock at the end of each business day. The table below shows the number of clocks in stock during a 5-day period in which no new clocks were received from the distributor. What are the domain and range of the function described by the table? 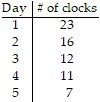
A. Domain = {1, 2, 3, 4, 5}; range = {7, 11, 12, 16, 23} B. Domain = [1, 5]; range = [7, 23] C. Domain = [7, 23]; range = [1, 5] D. Domain = {7, 11, 12, 16, 23}; range = {1, 2, 3, 4, 5}