Of the curves displayed in the graph shown, what does curve B most likely represent?
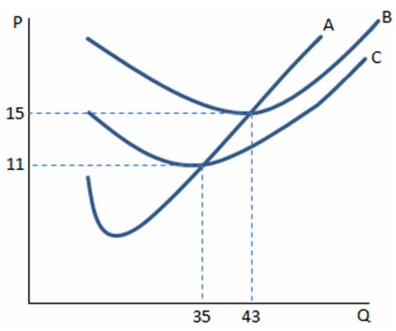
A. Marginal cost
B. Average total cost
C. Average variable cost
D. Average fixed cost
B. Average total cost
You might also like to view...
The notion that in a world with n markets, if n - 1 are in equilibrium, so must the nth, is known as
A) the uncertainty principle. B) the first law of international trade. C) Walras Law. D) Friedman Law.
What do prices reflect in a market economy?
According to the law of increasing opportunity costs,
A. Greater production means factor prices rise. B. Higher opportunity costs induce higher output per unit of input. C. Greater production leads to greater inefficiency. D. Greater production of one good requires increasingly larger sacrifices of other goods.
Figure 34-9
?
 In Figure 34-9, at price OC total quantity demanded exceeds quantity supplied and price will rise to
A. OJ in Pastaland. B. OA in Pestoland. C. OA in both countries. D. OJ in both countries.