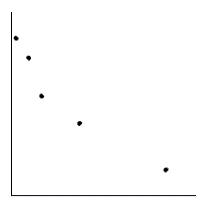
Let x be the average number of employees in a group health insurance plan, and let y be the average administrative cost as a percentage of claims. Suppose a random sample of employees gave the following information.
x
2
8
14.00
32
73
y
50
45
35
28
16
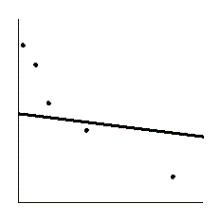
Draw the line that best fits the data whose scatter diagram is given below.
A.
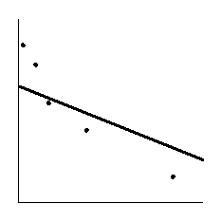
B.
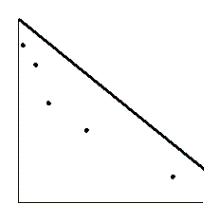
C.
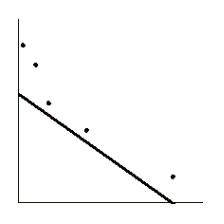
D.
E.
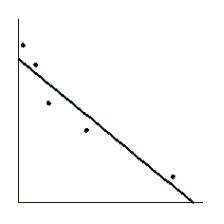
Answer: E
Mathematics
You might also like to view...
Determine an equation that models the data best.
A. y =  x -
x - 
B. y = -  x -
x - 
C. y = -  x -
x - 
D. y =  x -
x - 
Mathematics
Multiply.
A. 540 B. 640 C. 550 D. 530
Mathematics
Plot the given point in the rectangular coordinate system.(-3, -1)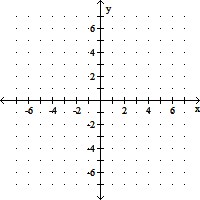
A. 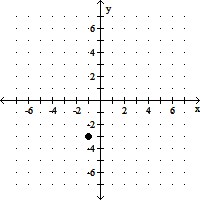
B. 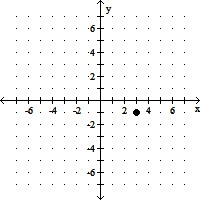
C. 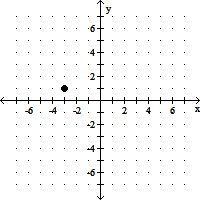
D. 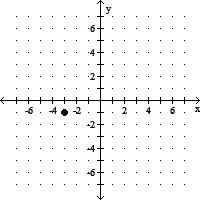
Mathematics
Compute the partial sum of the geometric series for the stated value of n. Round your answers to four decimal places.ak =  (k-1); n= 8
A. S8 = 0.6641 B. S8 = 0.6537 C. S8 = 2.2711 D. S8 = 2.7213
Mathematics