Solve the problem.The following table lists the unemployment rates for a certain country for several years. Use the data in the table to draw a graph. Then estimate the unemployment rate in 2004 and in 2006.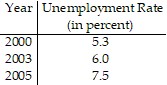
What will be an ideal response?
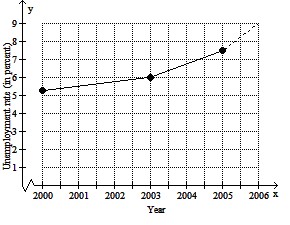
2004: About 6.75%
2006: About 9%
You might also like to view...
Match the function f with its graph.f(x) = ln (x)
A. 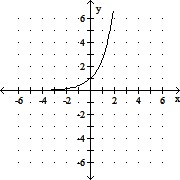
B. 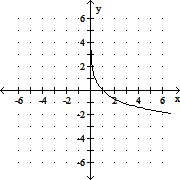
C. 
D. 
Factor by grouping.8a3 - 20a2b + 10ab2 - 25b3
A. (8a2 + 5b2)(a - 5b) B. (4a2 + 5b)(2a - 5b) C. (4a2 - 5b2)(2a + 5b) D. (4a2 + 5b2)(2a - 5b)
Give the inverse operation for the statement. Then write a function f for the given statement and a function g for its inverse operation.Divide x by 7 and then add 14 to the result.
A. Subtract 14 from x and multiply the result by 7; f(x) =  + 14; g(x) = 7(x - 14)
B. Subtract 14 from x and divide the result by 7; f(x) =  + 14; g(x) =
C. Subtract 7 from x and multiply the result by 14; f(x) =  + 7; g(x) = 14(x - 7)
D. Subtract 7 from x and divide the result by 14; f(x) =  + 7; g(x) =
Let f be an exponential function of the form f(x) = bx. Answer the following. Find b for which the graph of f passes through (-3, 8).
A. 
B. - 
C. -2
D. 