Graph the function.y =  - 2
- 2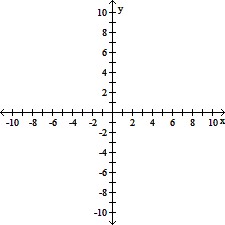
A. 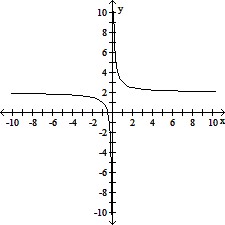
B. 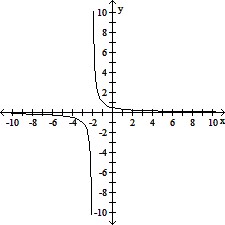
C. 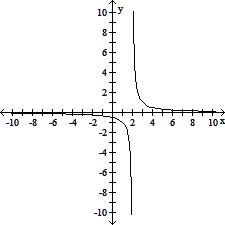
D. 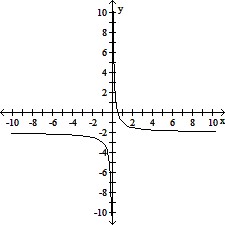
Answer: D
You might also like to view...
Use l'Hopital's Rule to evaluate the limit.

A. -5 B. 1 C. 5 D. 0
Determine the amplitude and range of the function and sketch its graph.y = 3 sin x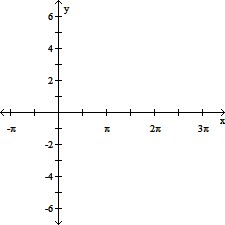
A. amplitude: 3; range: [0, 3]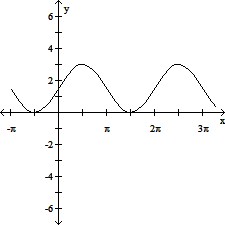
B. amplitude: 3; range: [0, 3]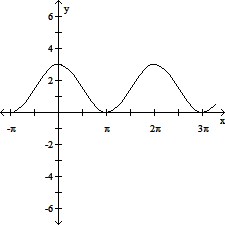
C. amplitude: 3; range: [-3, 3]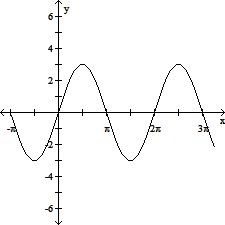
D. amplitude: 3; range: [-3, 3]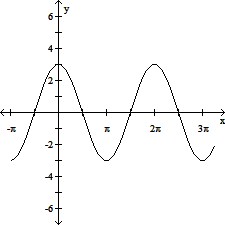
Solve.The highest point at an oil drilling operation is the top of the 76-foot-high oil drilling rig. The lowest point the drill head has reached so far is -225 feet. How far above the drill head is the top of the oil drilling rig?
A. -301 ft B. 301 ft C. -225 ft D. 149 ft
An objective function and a system of linear inequalities representing constraints are given. Graph the system of inequalities representing the constraints. Find the value of the objective function at each corner of the graphed region. Use these values to determine the maximum value of the objective function and the values of x and y for which the maximum occurs.Objective Function z = 6x + 7yConstraints x ? 0 y ? 0 2x + 3y ? 12 2x + y ? 8
A. maximum 32; at (3, 2) B. maximum 52; at (4, 4) C. maximum 32; at (2, 3) D. maximum 24; at (4, 0)