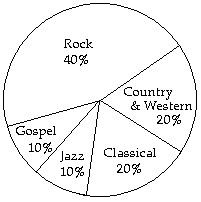
Describe the given distribution with a circle graph.A questionnaire was sent to customers asking about their music preferences. The customers were asked to pick the type of music they preferred from the categories rock, classical, gospel, country & western, and jazz. The results are shown in the table. Make a circle graph based on the data in the table.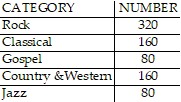
What will be an ideal response?
Mathematics
You might also like to view...
Solve the inequality. Write the solution set in interval notation and graph it.f + 1 < 9![]()
A. (-?, 8)![]()
B. [8, ?)![]()
C. (8, ?)![]()
D. (-?, 8]![]()
Mathematics
Substitute the value(s) for the variable(s) and then evaluate. 2 ? c2; m = 2, c = 4
A. 2048 B. 1024 C. 80 D. 64
Mathematics
Insert <, >, or = to form a true statement.0.99900  0.999
0.999
A. > B. < C. =
Mathematics
Choose the most reasonable metric length unit. Choose from km, m, cm, and mm.Marian drove 331  on vacation.
A. m B. km C. cm D. mm
Mathematics