Make a line graph of the data in the table.The following table gives the average cost of producing a music video over the given years. Use time on the horizontal scale for your line graph.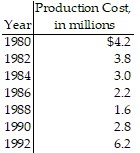
What will be an ideal response?
Answers may vary. A possible answer follows.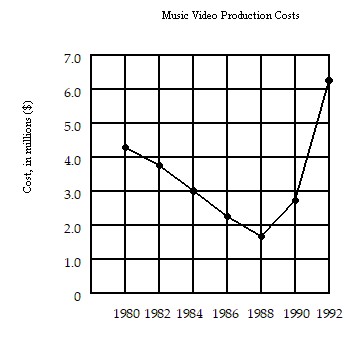
Mathematics
You might also like to view...
Solve.x2 - 25y2 = 36x + 5y = 4
A. 
B. No real solutions exist.
C. 
D. 
Mathematics
Solve the equation. Check your solution.-13 = 6x + 5
A. {-3} B. {7} C. {-24} D. {-20}
Mathematics
A capacitor is marked as a 41 æf. The following values are measured from a bin containing several values in æf. Calculate the mean value.
40, 42, 40, 39, 40, 42, 41, 41 a. 40.6 b. 39.7 c. 41.2 d. 40
Mathematics
Find the LCD for the given fractions. ,
,  , and
, and 
A. 30 B. 12 C. 60 D. 20
Mathematics