Analyze the graph of the given function f as follows:(a) Determine the end behavior: find the power function that the graph of f resembles for large values of |x|.(b) Find the x- and y-intercepts of the graph.(c) Determine whether the graph crosses or touches the x-axis at each x-intercept.(d) Graph f using a graphing utility.(e) Use the graph to determine the local maxima and local minima, if any exist. Round turning points to two decimal places.(f) Use the information obtained in (a) - (e) to draw a complete graph of f by hand. Label all intercepts and turning points.(g) Find the domain of f. Use the graph to find the range of f.(h) Use the graph to determine where f is increasing and where f is decreasing.f(x) = (x - 3)(x - 1)(x + 2)
What will be an ideal response?
(a) For large values of |x|, the graph of f(x) will resemble the graph of y = x3.
(b) y-intercept: (0, 6), x-intercepts: (-2, 0), (1, 0), and (3, 0)
(c) The graph of f crosses the x-axis at each of the intercepts (-2, 0), (1, 0), and (3, 0)
(e) Local maximum at (-0.79, 8.21); Local minimum at (2.12, -4.06)
(f) 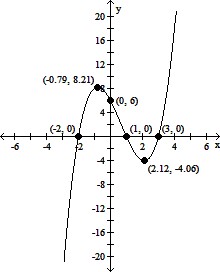
(g) Domain of f: all real numbers; range of f: all real numbers
(h) f is increasing on (-?, -0.79) and (2.12, ?); f is decreasing on (-0.79, 2.12)
You might also like to view...
Rationalize the denominator. Simplify, if possible.
A. 
B. 
C. 
D. 
Perform the indicated operation and simplify. Write the answer in the form a + bi. ?
? 
A. - i
i
B. 
C. -
D.  i
i
Find the unknown value.56.5% of 4000 is what number?
A. 1740 B. 2260 C. 1760 D. 2000
Find a rectangular equation for the plane curve defined by the parametric equations.x = t3 + 1, y = t3 - 10; -2 ? t ? 2
A. y = x3; for x in -3 ? x ? 1 B. y = x - 11; for x in -7 ? x ? 9 C. y = - x - 11; for x in -7 ? x ? 9 D. y = - x2; for x in -4 ? x ? 4