Use the figure below to answer the following question.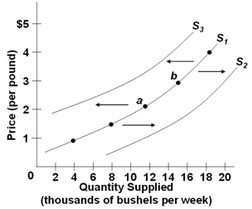 The figure above shows three supply curves for wheat. Which of the following would cause the quantity of wheat supplied to decrease from point b to point a?
A. an increase in the price of wheat
B. a subsidy for wheat production
C. a decrease in the price of wheat
D. a tax on wheat production
Answer: C
You might also like to view...
The prospect of future deficits
A) would prompt government to vastly expand discretionary spending. B) limits the ability of government to conduct fiscal policy in the near future. C) requires a government to eliminate all entitlement spending. D) encourages government to conduct expansionary fiscal policy.
Mrs. Wallace and Mrs. Jackson both signed up for 6 months (each incurred a $200 total payment required in advance, and nonrefundable) at the local workout club. Wallace enjoyed all 6 months
Jackson dropped out after three months due to other unexpected commitments. Which of the following is true? A) Wallace's sunk cost was zero. B) Jackson's sunk cost was $100. C) Jackson's sunk cost was $200, and so was Wallace's. D) Wallace's sunk cost was $100. E) None of the above.
A network externality refers to a situation where:
A) the value of a product increases as more consumers start to use it. B) firms collude to sell products at a price higher than the equilibrium market price. C) a firm that has control over key resources auctions the resources off to other firms. D) the government interferes to prevent the concentration of market power in the hands of a few firms.
Discuss the significant laws passed since the Great Depression that affect labor-management relations
What will be an ideal response?