The graph of a function f is given. Use the graph to answer the question.Find the values of x, if any, at which f has a relative maximum. What are the relative maxima?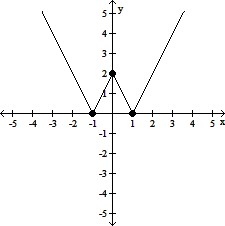
A. f has a relative maximum at x = 1; the relative maximum is 2
B. f has a relative maximum at x = 0; the relative maximum is 2
C. f has no relative maximum
D. f has a relative maximum at x = -1 and 1; the relative maximum is 0
Answer: B
You might also like to view...
State how many peaks you would expect for the distribution described.Numbers of people with birthdays in a particular month (January through December)
A. Two B. One C. Three D. None
Compare the graph of the given quadratic function f with the graph of y = x2.f(x) = (x - 5)2 + 2
A. Translated 2 units right and 5 units upward B. Translated 5 units left and 2 units downward C. Translated 5 units right and 2 units upward D. Translated 5 units left and 2 units upward
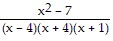
Simplify.
A. 
B. 1
C. 7
D. 7(a - 3b)
Simplify the expression. -
- 
A. 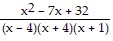
B. 
C. 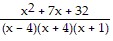
D.