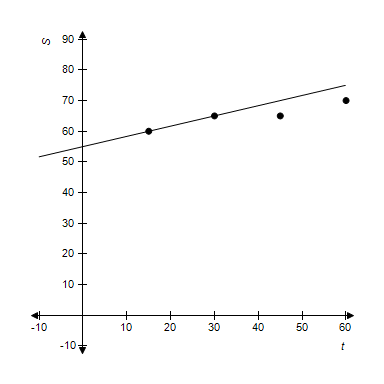
The following table shows the speed S of a car, in miles per hour, as a function of the time t, in seconds, since observation of the car began.
t 15 30 45 60 S 60.00 65.00 65.00 70.00?
?
A: Find the equation of the regression line.B: Plot the data along with the regression line.C: Explain in practical terms the meaning of the slope of the regression line.D: How fast would you expect this car to be traveling after 71 seconds?
What will be an ideal response?
A: 
?
B:
?
?
C: The speed increases by about 0.20 mile per hour for each second that passes, so the car is accelerating at a rate of 0.20 mile per hour per second.
?
D: About 71.70 miles per hour
Mathematics
You might also like to view...
Solve the problem.Find parametric equations for the normal line to the surface  at the point
A. 


B. 


C. 


D. 


Mathematics
Write the number in scientific notation.2,070,000
A. 2.7 × 10⁶ B. 2.07 × 10⁴ C. 2.07 × 10⁵ D. 2.07 × 10⁶
Mathematics
Simplify.5(6x + 4y) + 8(x + 3y)
A. 70x + 44y B. 14x + 7y + 5 C. 38x + 7y D. 38x + 44y
Mathematics
Multiply.-3x2(-5x5 + 8)
A. 15x7 + 8 B. 15x5 - 24 C. 15x7 - 24x2 D. -9x2
Mathematics