Analyze the graph of the given function f as follows:(a) Determine the end behavior: find the power function that the graph of f resembles for large values of |x|.(b) Find the x- and y-intercepts of the graph.(c) Determine whether the graph crosses or touches the x-axis at each x-intercept.(d) Graph f using a graphing utility.(e) Use the graph to determine the local maxima and local minima, if any exist. Round turning points to two decimal places.(f) Use the information obtained in (a) - (e) to draw a complete graph of f by hand. Label all intercepts and turning points.(g) Find the domain of f. Use the graph to find the range of f.(h) Use the graph to determine where f is increasing and where f is decreasing.f(x) = -2(x - 2)(x + 2)3
What will be an ideal response?
(a) For large values of |x|, the graph of f(x) will resemble the graph of y = -2x4.
(b) y-intercept: (0, 32), x-intercepts: (-2, 0) and (2, 0)
(c) The graph of f crosses the x-axis at (2, 0) and crosses the x-axis at (-2, 0).
(e) Local maximum at (1.00, 54.00)
(f) 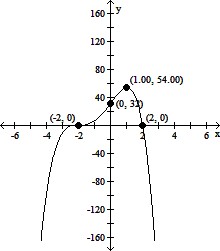
(g) Domain of f: all real numbers; range of f: (-?, 54.00]
(h) f is increasing on (-?, -2) and (-2, 1.00); f is decreasing on (1.00, ?)
Mathematics
You might also like to view...
Find the limit.

A. 2
B. 
C. 
D. 0
Mathematics
Simplify and add or subtract wherever possible.21 - 9
- 9
A. 60
B. 30
C. 12
D. 12
Mathematics
Provide the proper response.Explain how radical denominators are rationalized.
What will be an ideal response?
Mathematics
Solve the equation and check.
A. 
B. 
C. 
D. 
E. 
Mathematics