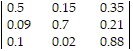
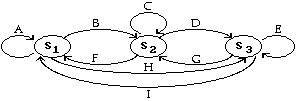
Construct the transition diagram and the transition matrix that represents the data.Fifty percent of those who call themselves liberal for the last election will vote as liberals in the next election, 15% will vote as conservatives, and 35% will vote as independents. 70% of those who voted as conservatives in the last election will do so in the next election, while 9% will vote as liberals, and 21% will vote as independents. 88% of those who voted as independents in the last election will do so in the next election, 10% will vote as liberals, and 2% will vote as conservatives.
A. 
| A = 0.5 | B = 0.15 | C = 0.7 |
G = 0.02 H = 0.35 I = 0.10
L C I

B.
| A = 0.35 | B = 0.15 | C = 0.7 |
G = 0.02 H = 0.5 I = 0.88
L C I

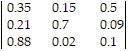
Answer: A
Mathematics
You might also like to view...
Between each pair of numbers, insert the appropriate sign, <, =, or >, to make a true statement.1.6 1.75
A. 1.6 > 1.75 B. 1.6 = 1.75 C. 1.6 < 1.75
Mathematics
A line segment containing the center and with endpoints on a circle is called a _______________ .
What will be an ideal response?
Mathematics
Solve the problem.The annual sales of a company's best-selling appliance can be modeled by a linear function. Suppose that the sales, in dollars, were 8500 in 1997 and 50,000 in 2002. Find a linear function for annual sales, S(x), letting  represent 1997.
A. S(x) = 41,500x + 50,000 B. S(x) = 8300x + 8500 C. S(x) = 8300x + 50,000 D. S(x) = 41,500x + 8500
Mathematics
Reduce to lowest terms.
A. x3 B. x2 C. 0 D. 1
Mathematics