Solve the problem.The graph below shows the number of tuberculosis deaths in the United States from 1989 to 1998.
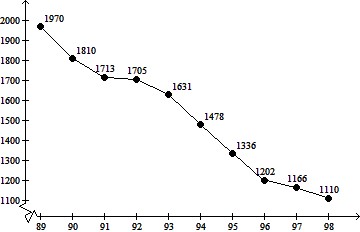 YearEstimate the average rate of change in tuberculosis deaths from 1991 to 1997.
A. About -460 deaths per year
B. About -60 deaths per year
C. About -120 deaths per year
D. About -1 deaths per year
Answer: C
You might also like to view...
Graph the function. Describe its position relative to the graph of the indicated basic function.f(x) = ln(x + 6); relative to f(x) = ln x
A. Moved left 6 units
B. Moved right 6 units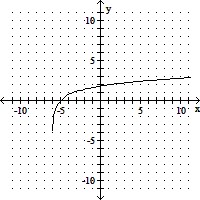
C. Moved left 6 units
D. Moved right 6 units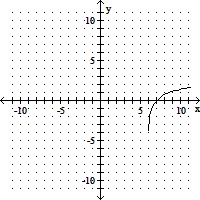
Divide.
A. 27 B. -27 C. 0 D. Undefined
Write a system of linear equations that models the situation. Do not solve.A truck is driven for 4 hours, part of the time at 20 miles per hour and the rest of the time at 60 miles per hour. The total distance traveled was  miles. How long did the truck travel at each speed?
A. x + y = 4 20x + 60y = 200 B. x + y = 200 20x + 60y = 4 C. x - y = 4 20x - 60y = 200 D. x + y = 40 60x + 20y = 200
Suppose you have the following project digraph. (The numbers in parentheses represent hours.) Scheduling this project with two processors results in a finishing time shorter than 22 hours using the priority list
A. C, F, E, B, A, D. B. C, F, A, B, D, E. C. C, D, B, E, A, F. D. C, B, A, F, E, D. E. none of these