Find the Taylor series generated by f at x = a.f(x) =  , a = 7
A. 
B. 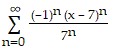
C. 
D. 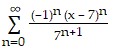
Answer: D
You might also like to view...
Provide an appropriate response.Boxplots are graphs that are useful for revealing central tendency, the spread of the data, the distribution of the data and the presence of outliers. Draw an example of a box plot and comment on each of these characteristics as shown by your boxplot.
What will be an ideal response?
Answer the question.How can the graph of f(x) = -4|x| be obtained from the graph of 
A. Stretch it vertically by multiplying each y-coordinate by 4. Reflect it across the y axis. B. Stretch it vertically by multiplying each y-coordinate by -4. Reflect it across the x axis. C. Stretch it vertically by multiplying each y-coordinate by 4. Reflect it across the x axis. D. Stretch it vertically by multiplying each y-coordinate by -4. Reflect it across the y axis.
Graph the equation.r = 1 - 4 cos ?
A. 
B. 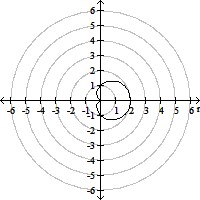
C. 
D. 
Solve the problem.The function, S(x) = , gives the predicted sales volume of a company, in millions of items, where x is the number of years from now. Determine the predicted sales 9 years from now. Round your answer to two decimals, if necessary.
A. 38.42 million B. 18.88 million C. 35.34 million D. 19.59 million