First, rewrite each equation in exponential form. Then, use a table of coordinates and the exponential form to graph the logarithmic function. Begin by selecting -2, -1, 0, 1 and 2 for y. Finally, based on your graph, describe the shape of a scatter plot that can be modeled by f(x) = log b x, 0 < b < 1.y = log1/9 x
A. 
increasing
B. 
increasing,
although rate of increase is slowing down
C. 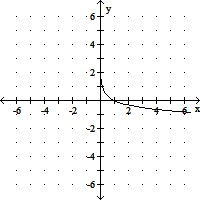
decreasing,
although rate of decrease is slowing down
D. 
decreasing,
although rate of decrease is slowing down
Answer: C
You might also like to view...
Solve the problem relating to the Fibonacci sequence.List the first seven terms of the Fibonacci sequence.
A. 1, 1, 2, 3, 5, 8, 13 B. 1, 2, 4, 6, 10, 16, 26 C. 1, 2, 3, 5, 8, 13, 21 D. 1, 1, 3, 4, 7, 11, 18
Write the ordered pair for each point shown in the xy plane.
A. A = (1, 3), B = (5, 3) B. A = (5, 18), B = (3, -5) C. A = (1, 5), B = (3, -5) D. A = (1, 5), B = (-5, 3)
Estimate the sum or difference by rounding each number to the nearest hundred.
A. 600 B. 200 C. 138 D. 100
Simplify the expression. Assume all variables represent positive real numbers.
A. 
B. 
C. 
D. 