Present data in the form of tables. For the data set shown by the table, a. Create a scatter plot for the data. b. Use the scatter plot to determine whether an exponential function or a logarithmic function is the best choice for modeling the data.Percentage of Population Living in the South Suburbs of a Large City 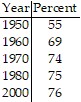
What will be an ideal response?
a.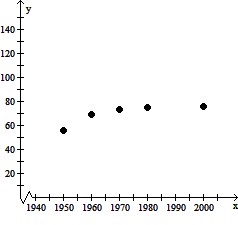
b. Logarithmic Function
Mathematics
You might also like to view...
Use counting to determine the whole number that corresponds to the cardinality of the set.A = {x?x is a second in a minute}
A. n(A) = 120 B. n(A) = 30 C. n(A) = 60 D. Infinite
Mathematics
Write in simplified form and list all restrictions on the domain.f(x) = 
A. f(x) =  , x ? -2, 2
B. f(x) =  , x ? -2
C. f(x) =  , x ? 2
D. f(x) =  , x ? -2
Mathematics
Divide, if possible. If a quotient is undefined, state so.42 ÷ (-7)
A. 7 B. -7 C. -6 D. 6
Mathematics
Fill in the blank with one of the words or phrases listed below.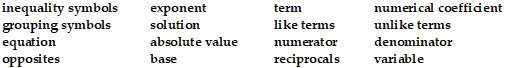 A(n)
A(n)  of an equation is a value for the variable that makes the equation a true statement.
A. base B. denominator C. solution D. term
Mathematics