The following comparison line graph indicates the number of vehicles sold for a seven week period by two different salespeople. Use the graph to answer the question.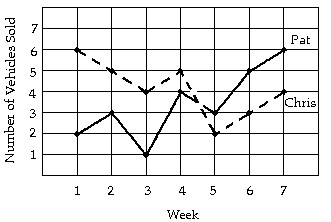 How many more vehicles did Chris sell in the first week than did Pat sell in the second week?
A. 5 vehicles
B. 3 vehicles
C. 2 vehicles
D. 4 vehicles
Answer: B
Mathematics
You might also like to view...
Solve the problem.An election is held among six candidates. What is the total number of pairwise comparisons in this election?
A. 62
B. 26
C. 
D. 6
E. 2 × 6
Mathematics
Translate to an equation and solve. 14 is what percent of 7?
A. 50% B. 100% C. 150% D. 200%
Mathematics
Solve the equation.g - 27.22 = 0
A. 26.22 B. -26.22 C. -27.22 D. 27.22
Mathematics
Graph.f(x) = 4x2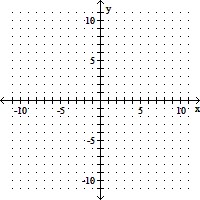
A. 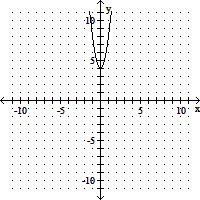
B. 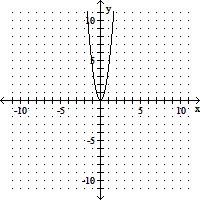
C. 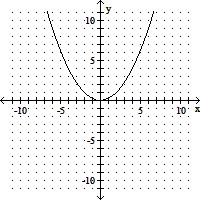
D. 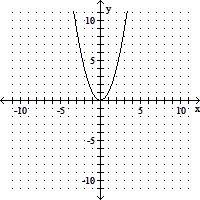
Mathematics