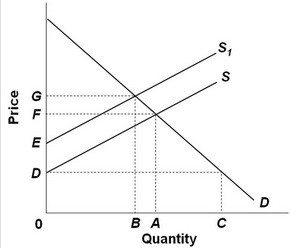
 Refer to the above supply and demand graph. In the graph, point A is the current equilibrium level of output of this product and point B is the optimal level of output from society's perspective. This figure indicates that there is(are):
A. positive externalities created in the production of this product.
B. an underallocation of resources to product production.
C. a surplus of the good produced.
D. negative externalities created in the production of this product.
Answer: D
You might also like to view...
A devaluation causes which of the following to occur in the medium run?
A) an increase in net exports B) an increase in the price level C) an increase in output D) all of the above E) none of the above
Which of the following is not a characteristic of monopolistic competition?
A) There are many buyers and sellers. B) There are low barriers to entry. C) Average revenue is equal to price. D) The products sold by all firms are identical.
Refer to the information provided in Figure 4.3 below to answer the question(s) that follow.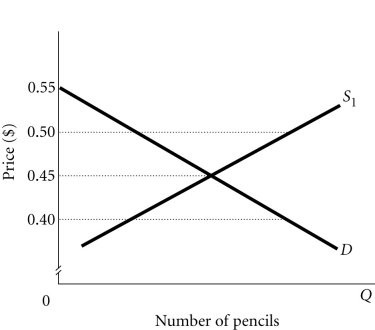 Figure 4.3Refer to Figure 4.3. If the government will not allow retailers to charge more than $0.40 for a pencil, which of the following will happen?
A. Supply must eventually increase so that the market will come into equilibrium at a price of $0.40. B. A nonprice rationing system such as queuing must be used to ration the available supply of pencils. C. Demand must eventually decrease so that the market will come into equilibrium at a price of $0.40. D. The market will be in equilibrium at a price of $0.40.
An industry has a single firm, and is found to have violated antitrust laws. The government breaks its up into two firms that will share the market equally. The Herfindahl index for this industry would change from:
A. 100 to 50 B. 10000 to 2500 C. 100000 to 50000 D. 10000 to 5000