According to the graph shown, if the market goes from equilibrium to having its price set at $10 then:
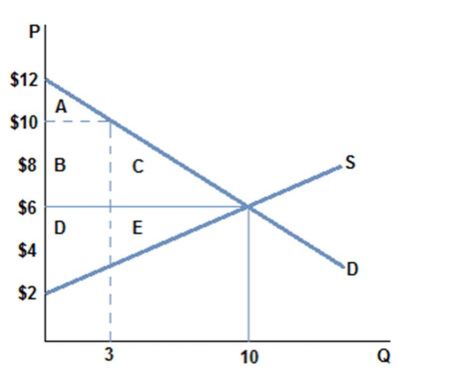
A. $12 gets transferred from consumer surplus to producer surplus.
B. area C is lost consumer surplus due to fewer transactions taking place.
C. area E is lost producer surplus due to fewer transactions taking place.
D. All of these are true.
D. All of these are true.
You might also like to view...
The total cost of production equals
a. average total cost + average variable cost b. average total cost + average fixed cost c. average variable cost + average fixed cost d. total fixed cost + total variable cost e. marginal cost + total variable cost
In the short run, the individual competitive firm's supply curve is that segment of the:
A. average variable cost curve lying below the marginal cost curve. B. marginal cost curve lying above the average variable cost curve. C. marginal revenue curve lying below the demand curve. D. marginal cost curve lying between the average total cost and average variable cost curves.
When making the decision to invest, the evaluation of the expected flow of future productive services that the investment project being considered will yield is an important consideration. This statement is accurate for
A. firms and households, but not for governments considering an investment project. B. firms, households, and governments. C. firms and governments, but not for households considering an investment project. D. firms, but not for governments and households considering an investment project.
Which type of income contributes the smallest share to total income in the U.S.?
A. Wages B. Interest C. Rent D. Profits