Solve the problem.The table shows the population of a certain city for selected years between 1950 and 2003. 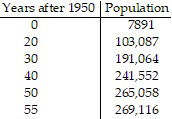 Use the logistic regression function on your calculator to determine the logistic equation that best fits the data.
A. P = 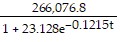
B. P = 
C. P = 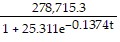
D. P = 
Answer: D
Mathematics
You might also like to view...
Make a sketch of the population function (as a function of time) that results from the given growth rate function. Assume the population at time t = 0 begins at some positive value.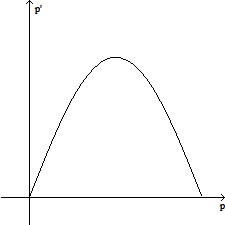
A. 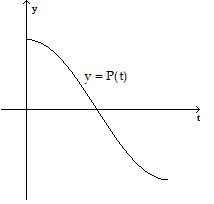
B. 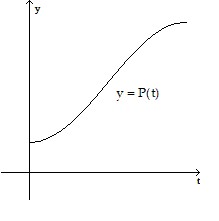
C. 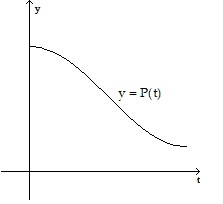
D. 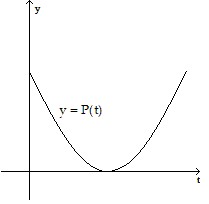
Mathematics
Graph each function.y = -7x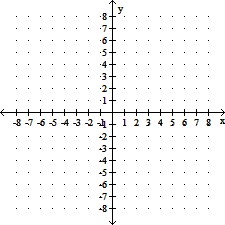
A. 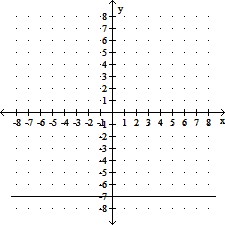
B. 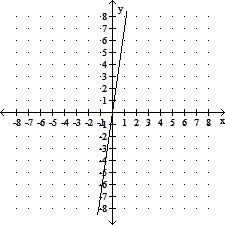
C. 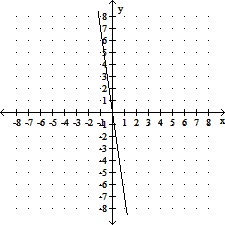
D. 
Mathematics
Write the fractions in lowest terms. Then determine whether the pair of fractions is equivalent or not equivalent. and
and 
A. Equivalent B. Not equivalent
Mathematics
Multiply and simplify. Leave your answer in exponential notation.3a5 ? 7a4
A. 21a20 B. 21a9 C. 1020 D. 109
Mathematics