Which of the diagrams best portrays the effects of an increase in resource productivity?
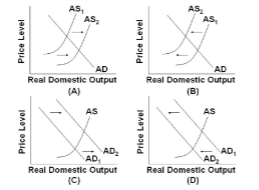
Use the following diagrams for the U.S. economy to answer the following question.
A. A.
B. B.
C. C.
D. D.
A. A.
You might also like to view...
To change the federal funds rate, the Fed
A) coordinates with banks on establishing the new rate. B) tells banks how much to charge. C) uses open market operations to change the quantity of reserves. D) changes the income tax rate on interest income. E) increases or removes money from the stock market.
Refer to the game between James and Theodore depicted in Figure 12.2. Which of the following is true?
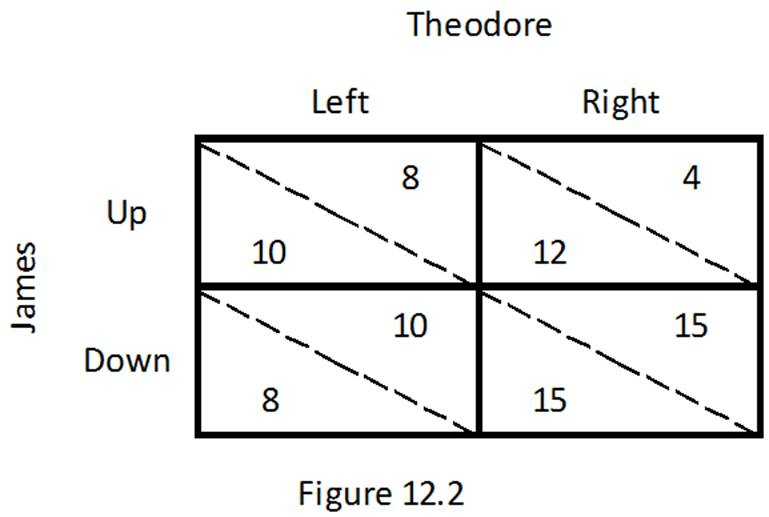
A. If James chooses Up, Theodore's best response is to choose Right.
B. If James chooses Down, Theodore's best response is to choose Left.
C. If Theodore chooses Left, James's best response is to choose Up.
D. If Theodore chooses Right, James's best response is to choose Up.
Monopolistically competitive firms can earn large profits in the long run
a. True b. False Indicate whether the statement is true or false
The market value of a bond on any given day is also known as its par value.
Answer the following statement true (T) or false (F)