Write the interval as an inequality involving x. Graph the inequality.[-3, 1)
A. -3 < x ? 1![]()
B. -3 ? x < 1![]()
C. -3 < x < 1![]()
D. -3 ? x ? 1![]()
Answer: B
You might also like to view...
Graph the solution set of the system.x + 2y ? 2 x - y ? 0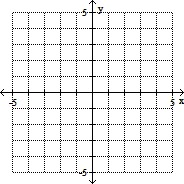
A. 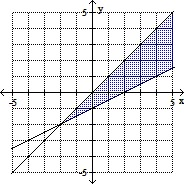
B. 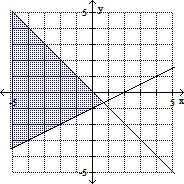
C. 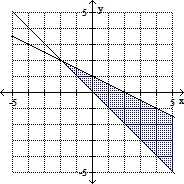
D. 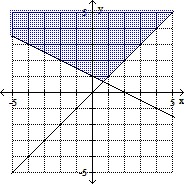
Solve the problem. Assume that probabilities are representative of the best strategies. Round to two decimal places, if necessary.A person is considering three different stocks, and each is sensitive to a certain economic indicator. The indicator will be positive, neutral, or negative, and fluctuate randomly. The payoffs are given in the table below, in thousands of dollars. What is the expected value of profit? 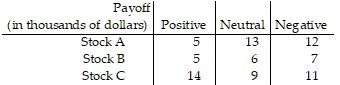
A. 10.54 B. 30 C. 5.18 D. 34
Provide an appropriate response.Sketch the graph of f(x) = -x2. At which of these points is the function decreasing?
A. 0 B. -3 C. -1 D. 1
Write the binomial divisor.- 112?35?-5-35?17?0
A. x2 + 12x + 35 B. x + 5 C. x - 5 D. x + 7