The table shows, for some particular year, a listing of several income levels and, for each level, the proportion of the population in the level and the probability that a person in that level bought a new car during the year. Given that one of the people who bought a new car during that year is randomly selected, find the probability that that person was in the indicated income category. Round your answer to the nearest hundredth. 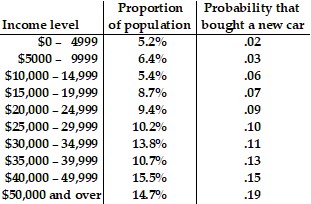 $10,000 - $14,999
A. .06
B. .05
C. .03
D. .02
Answer: C
You might also like to view...
Find the absolute extreme values of each function on the interval.f(x) = sin  , 0 ? x ?
A. Maximum value of 1 at x = 0; minimum value of -1 at x = ?
B. Maximum value of 1 at x =  ?; minimum value of -1 at x =
  ?,
?,
C. Maximum value of 1 at x =  ?; minimum value of -1 at x =
  ?,
?,
D. Maximum value of 1 at x =  ?; minimum value of -1 at x =
  ?
?
Find the sum of the series.
A. 32 B. 60 C. 128 D. 20
Provide an appropriate response.A line passes through the points (7, 1) and (1, 1). The equation of this line is ? . The slope of the line is ? .
A. x = 1; undefined B. x = 1; 0 C. y = 1; 0 D. y = 1; undefined
Simplify the expression. Assume that all variables represent positive real numbers.815/4
A. 243 B. 19,683 C. 2187 D. 6561